Unlocking Insights
Designing the next generation of analytics and reporting tools to empower LinkedIn creators
Background
Analytics is the top requested feature and consistently the biggest pain-point for content creators on LinkedIn
Starting in October 2022 I took the lead on designing new reporting tools and enhancing the slim analytics offerings available for creators on LinkedIn, so they can understand how their content is performing, and who their audience is.
Role
Design Lead responsible for the end - to - end user experience, and all design tasks for the entire project lifecycle
Team
A Multi-functional product team: 1 PM , 1 Engineering Manager, 9 Engineers, 2 Data Scientists, 1 UX Researcher
“The more data we can have as creators, the more optimal our content will be”
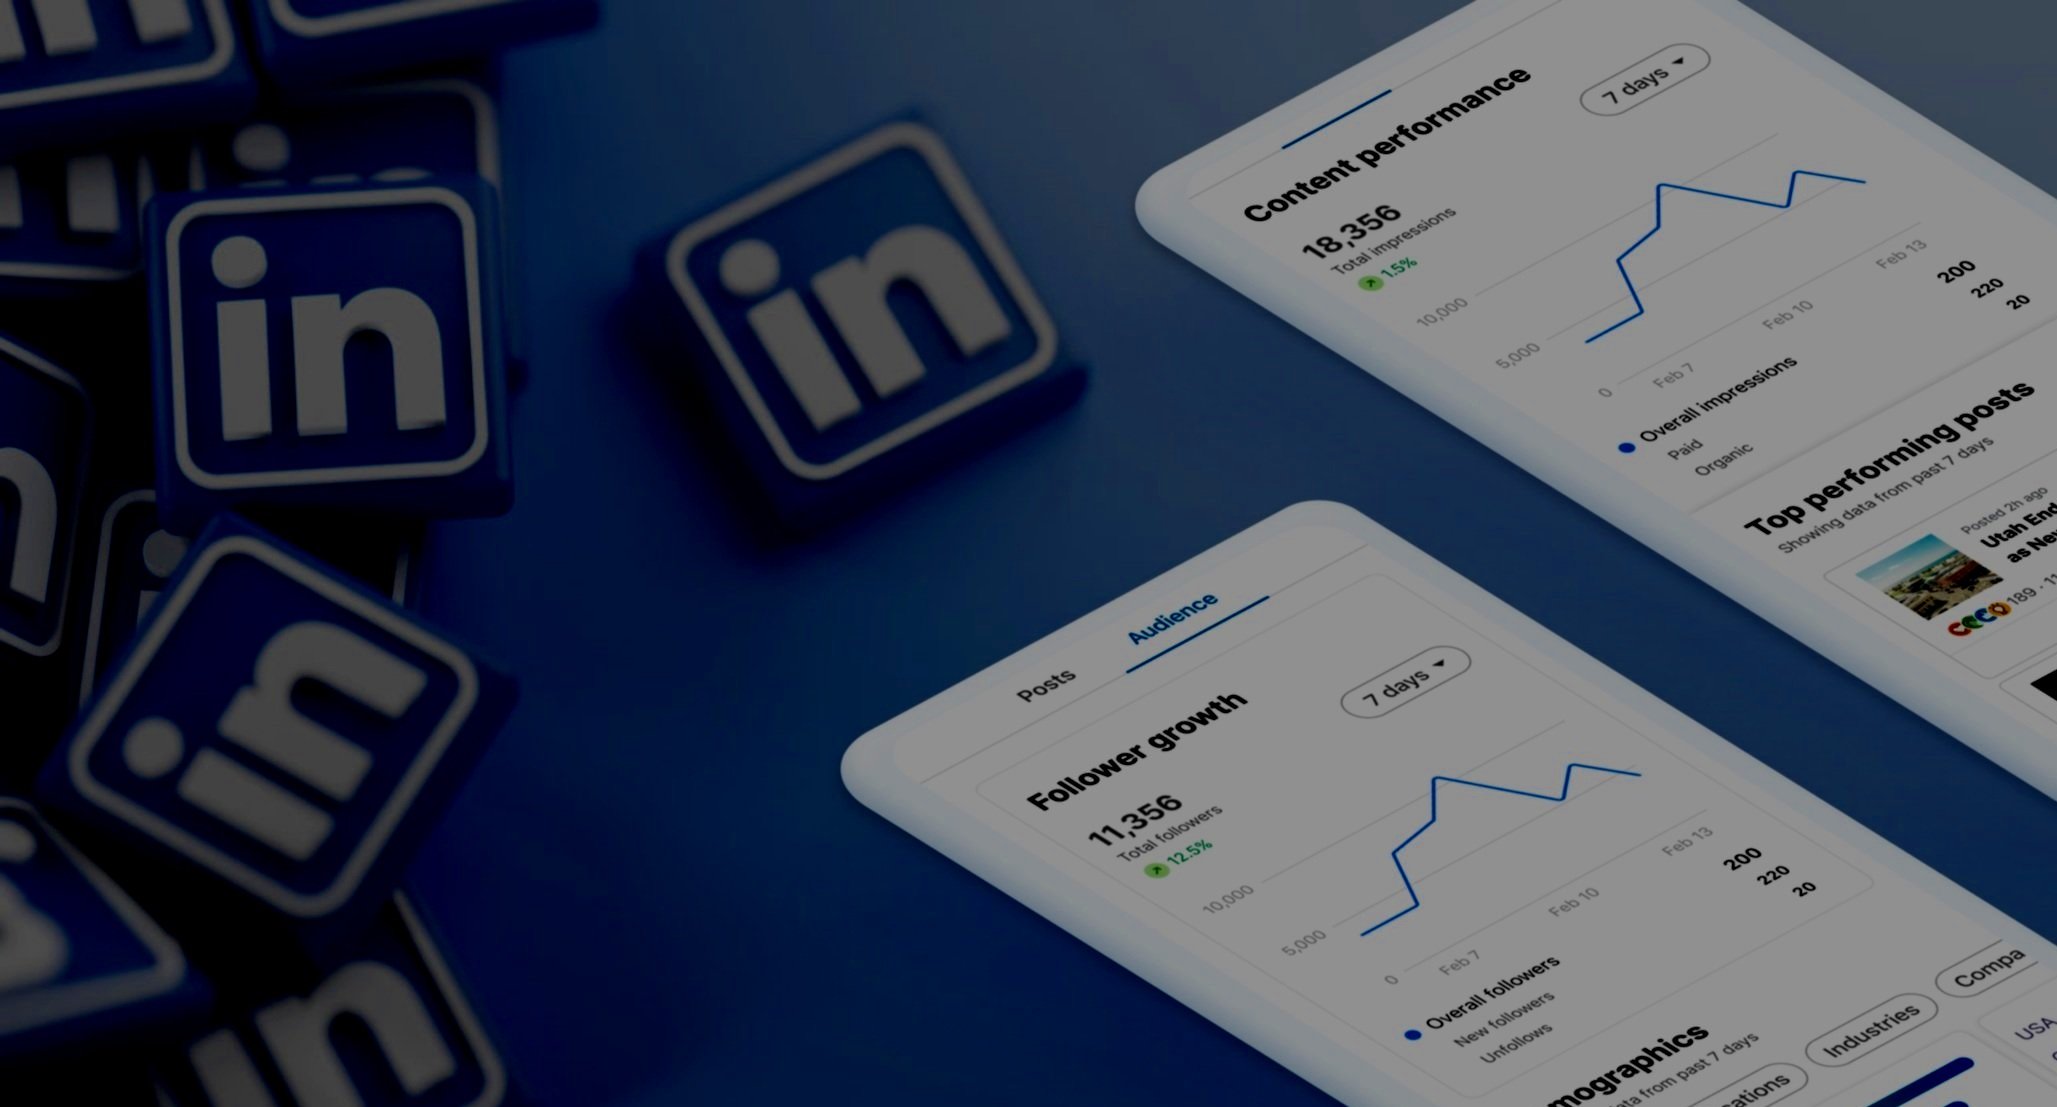
Filling the data gaps
-

Audience Analytics
Follower Growth: Follower count is one of the primary indicators of a creator's reach and influence
-
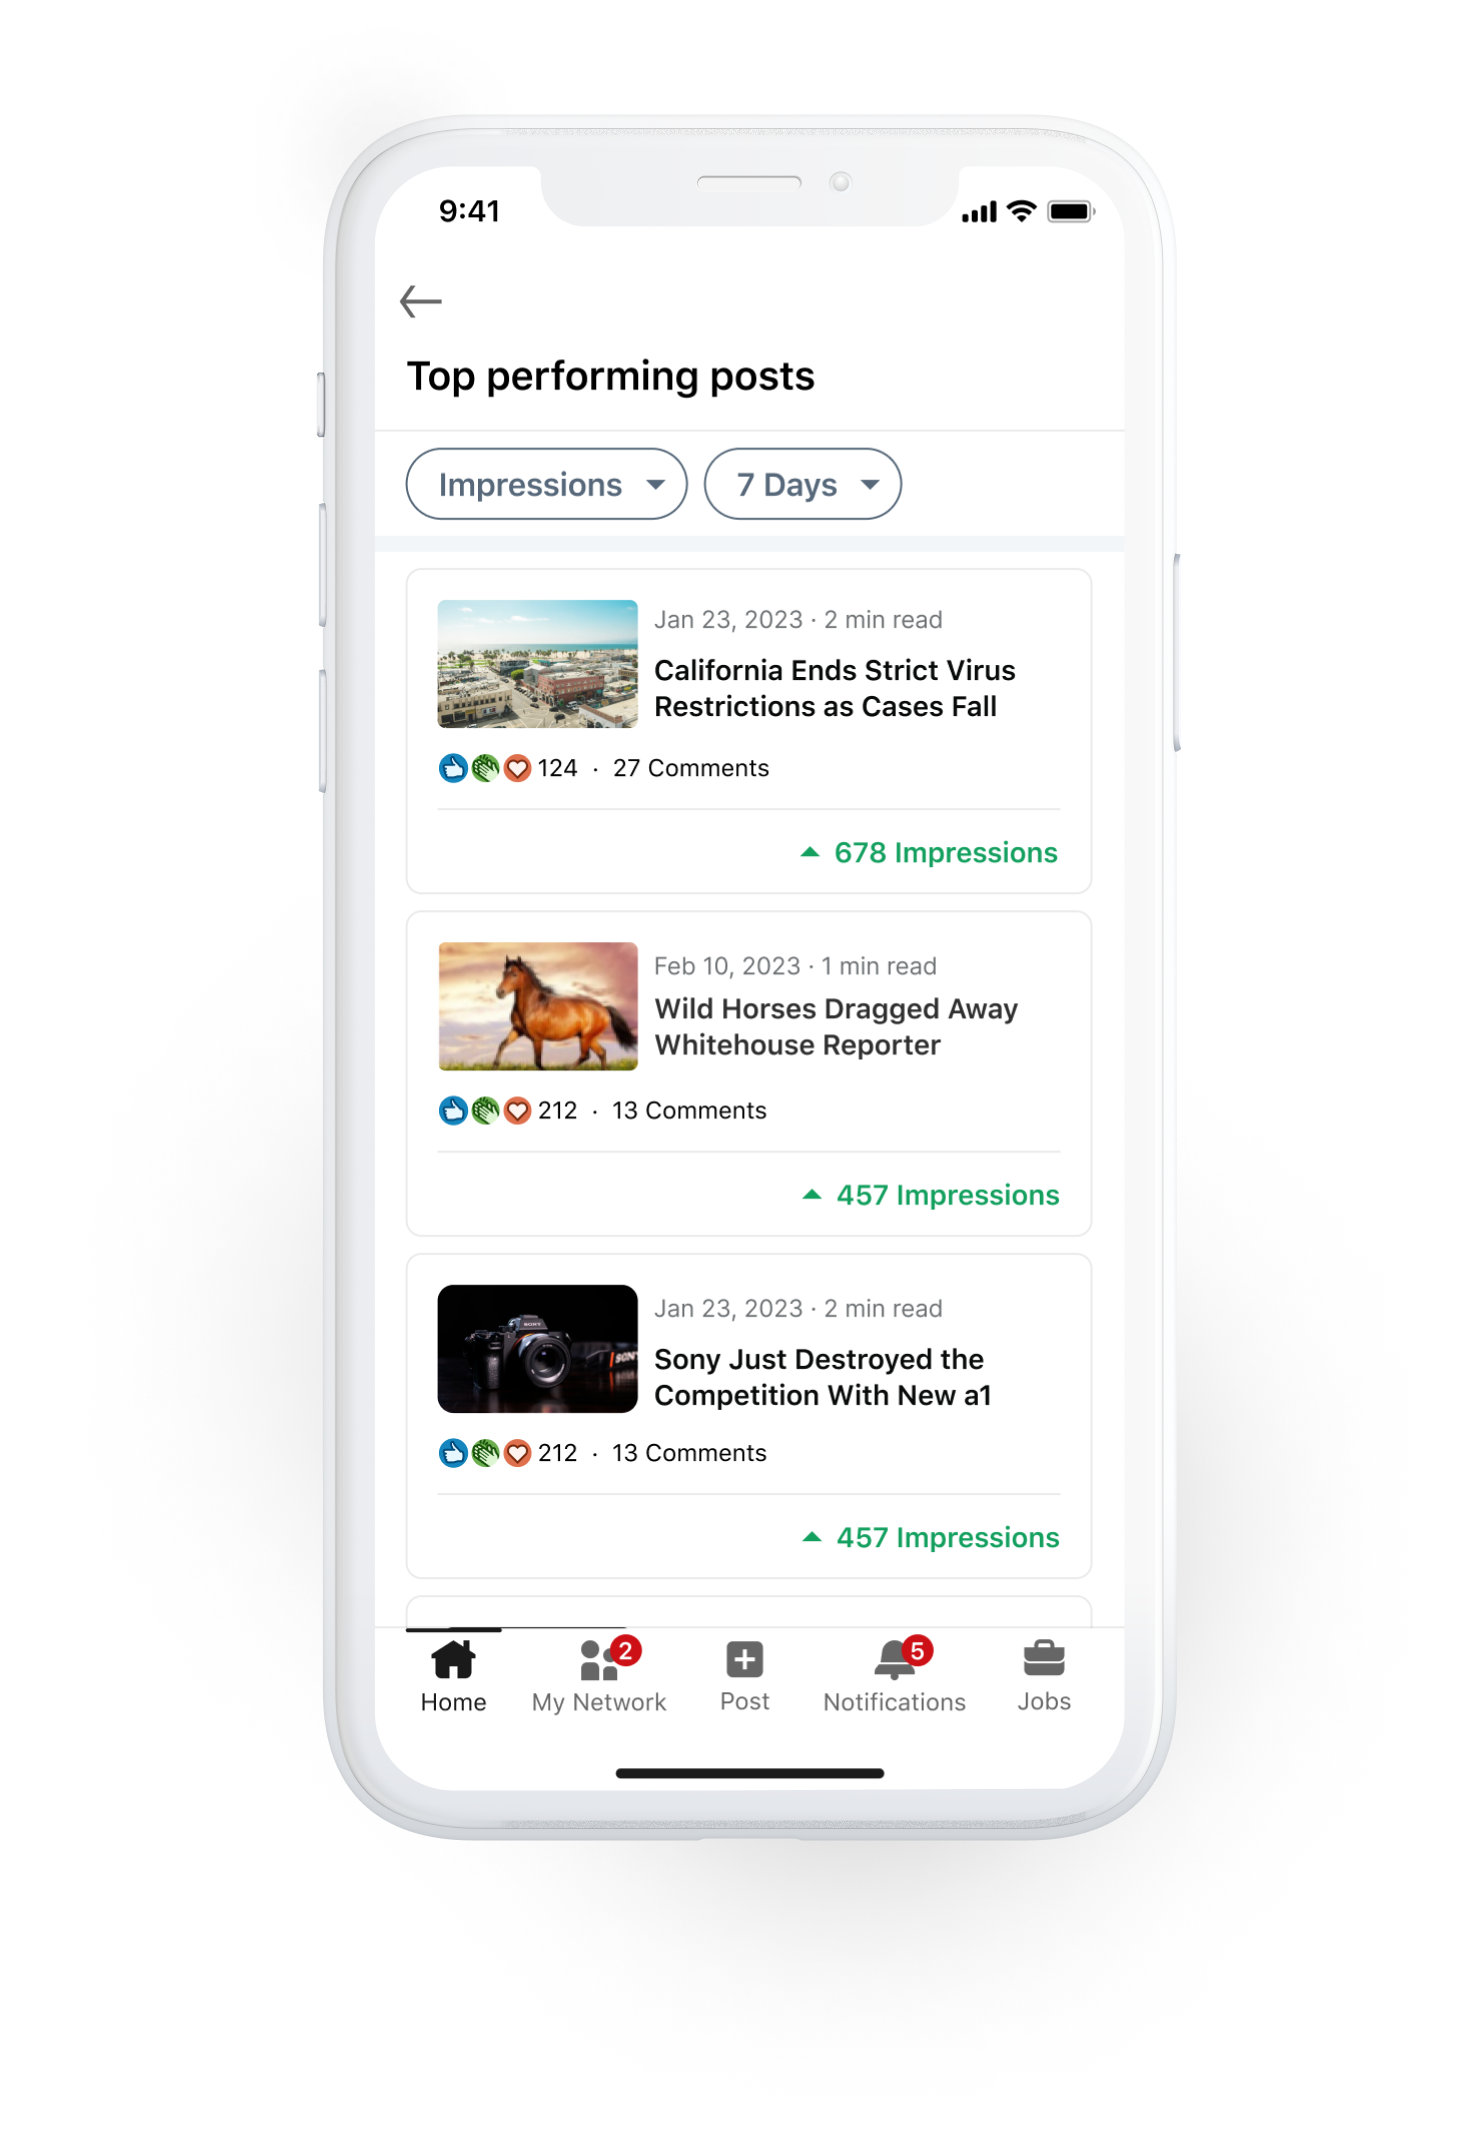
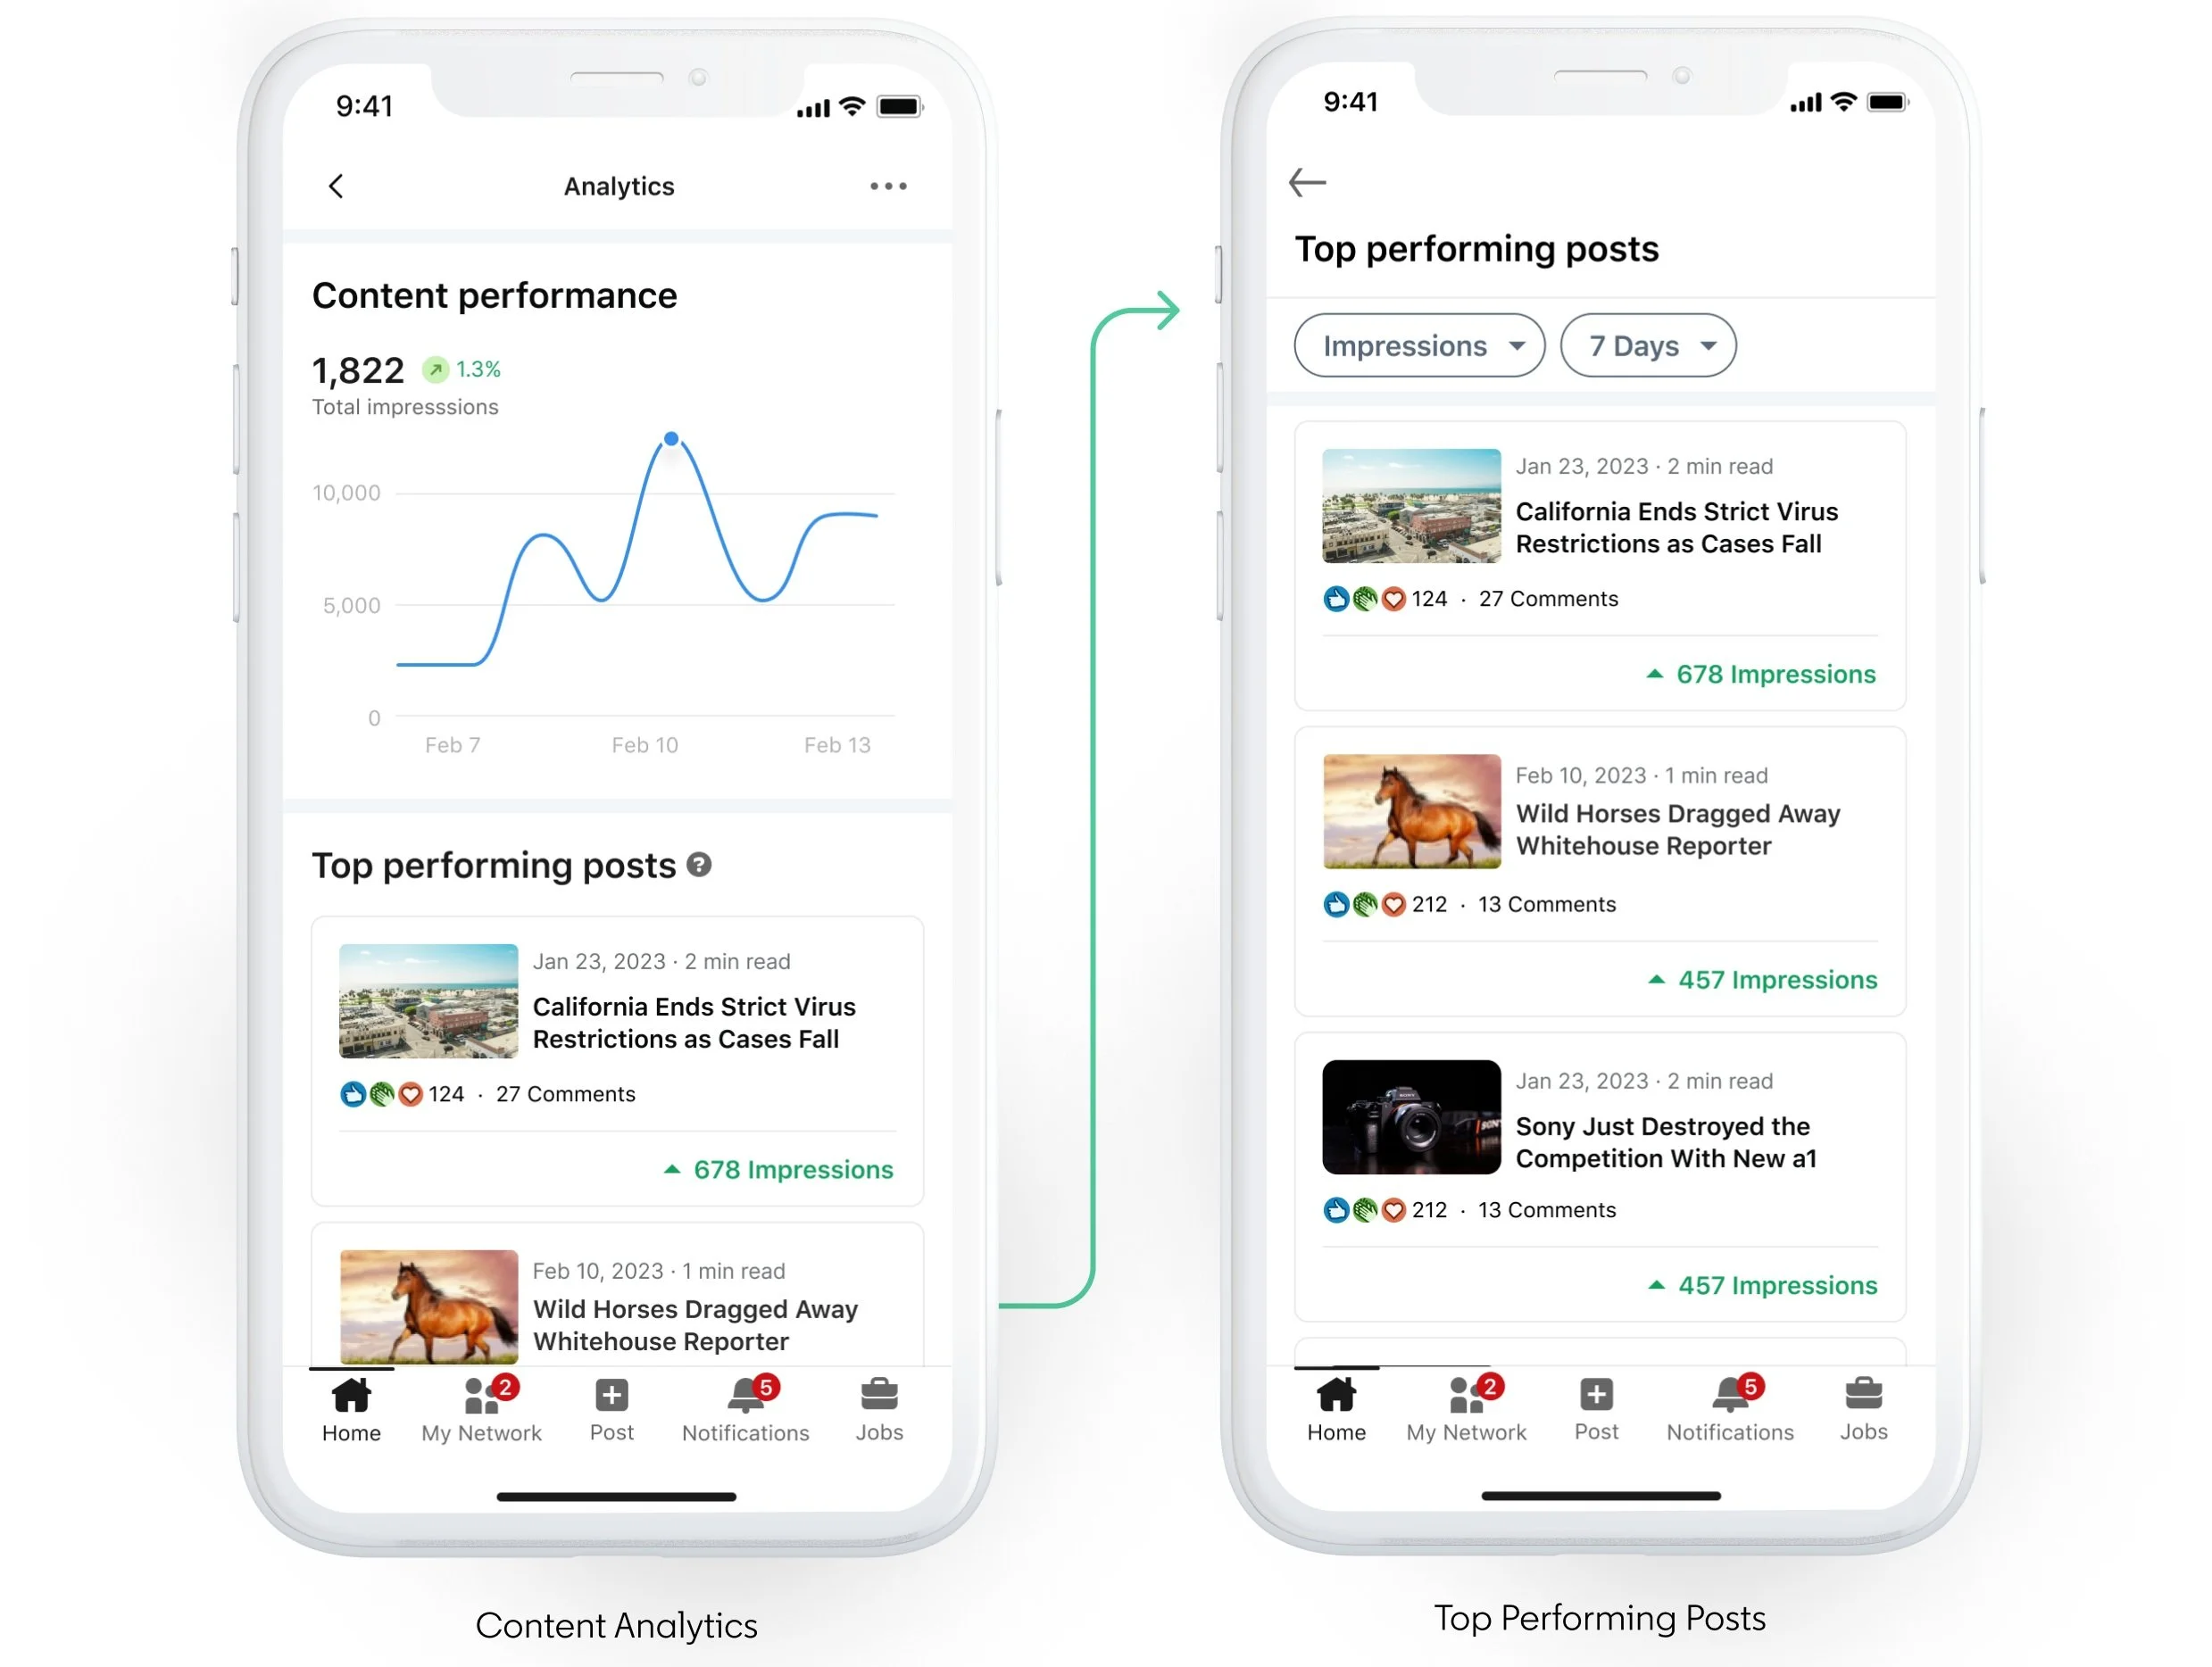
Top Performing Posts
The ability to compare post engagement metrics lets creators learn what’s resonating and how to improve
-
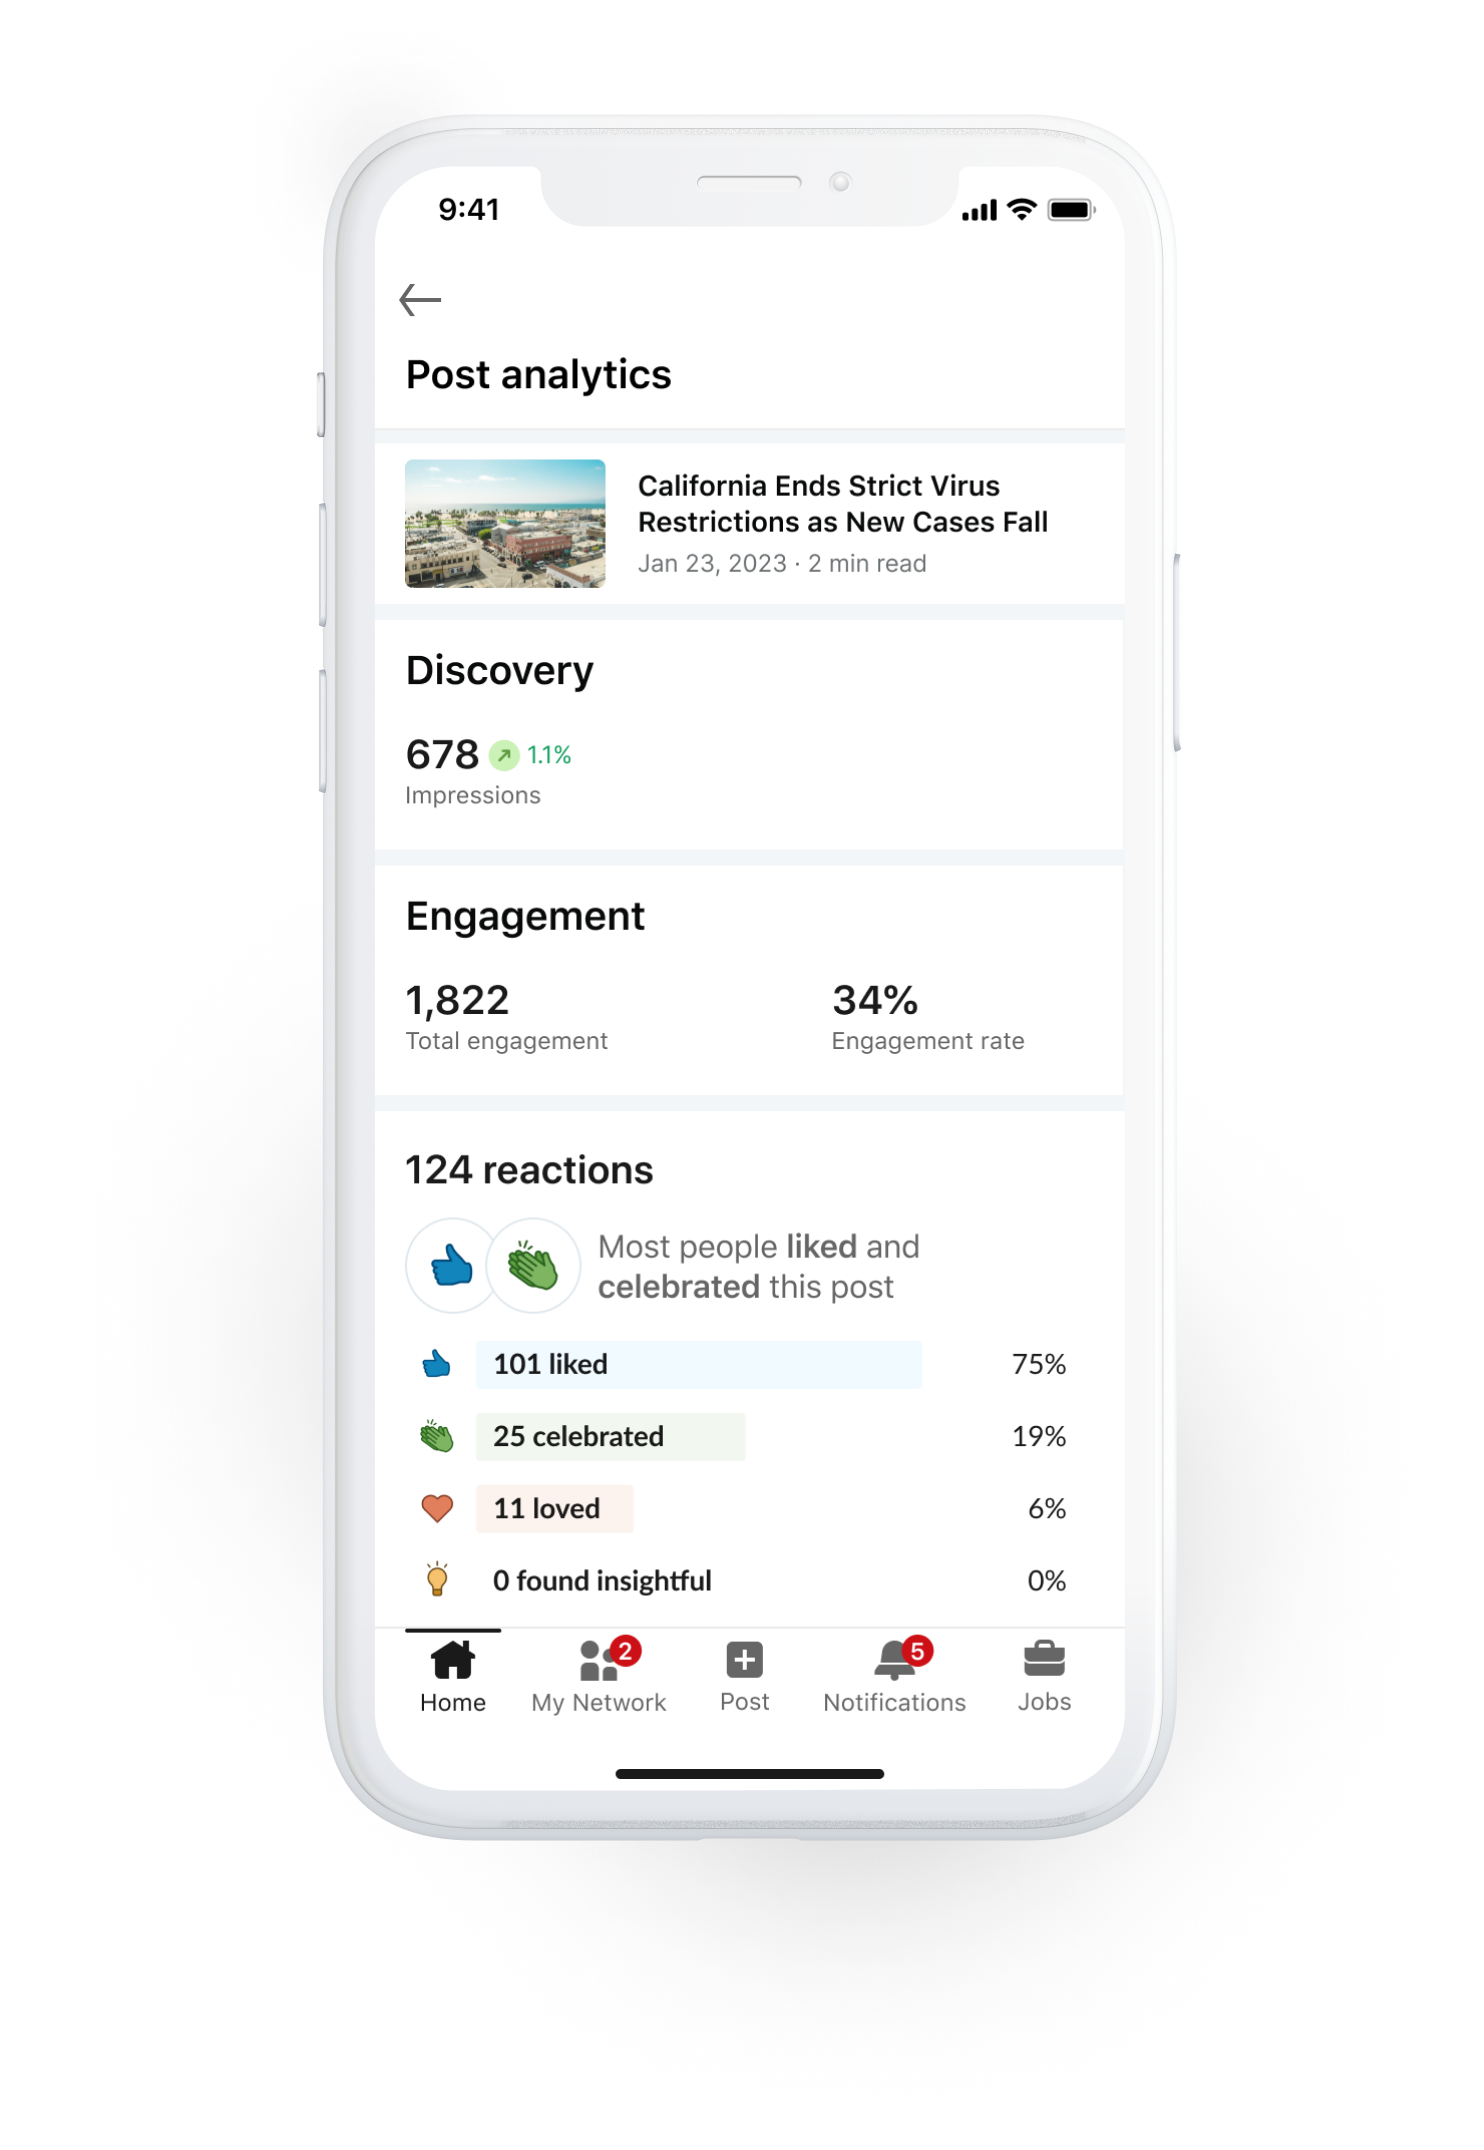
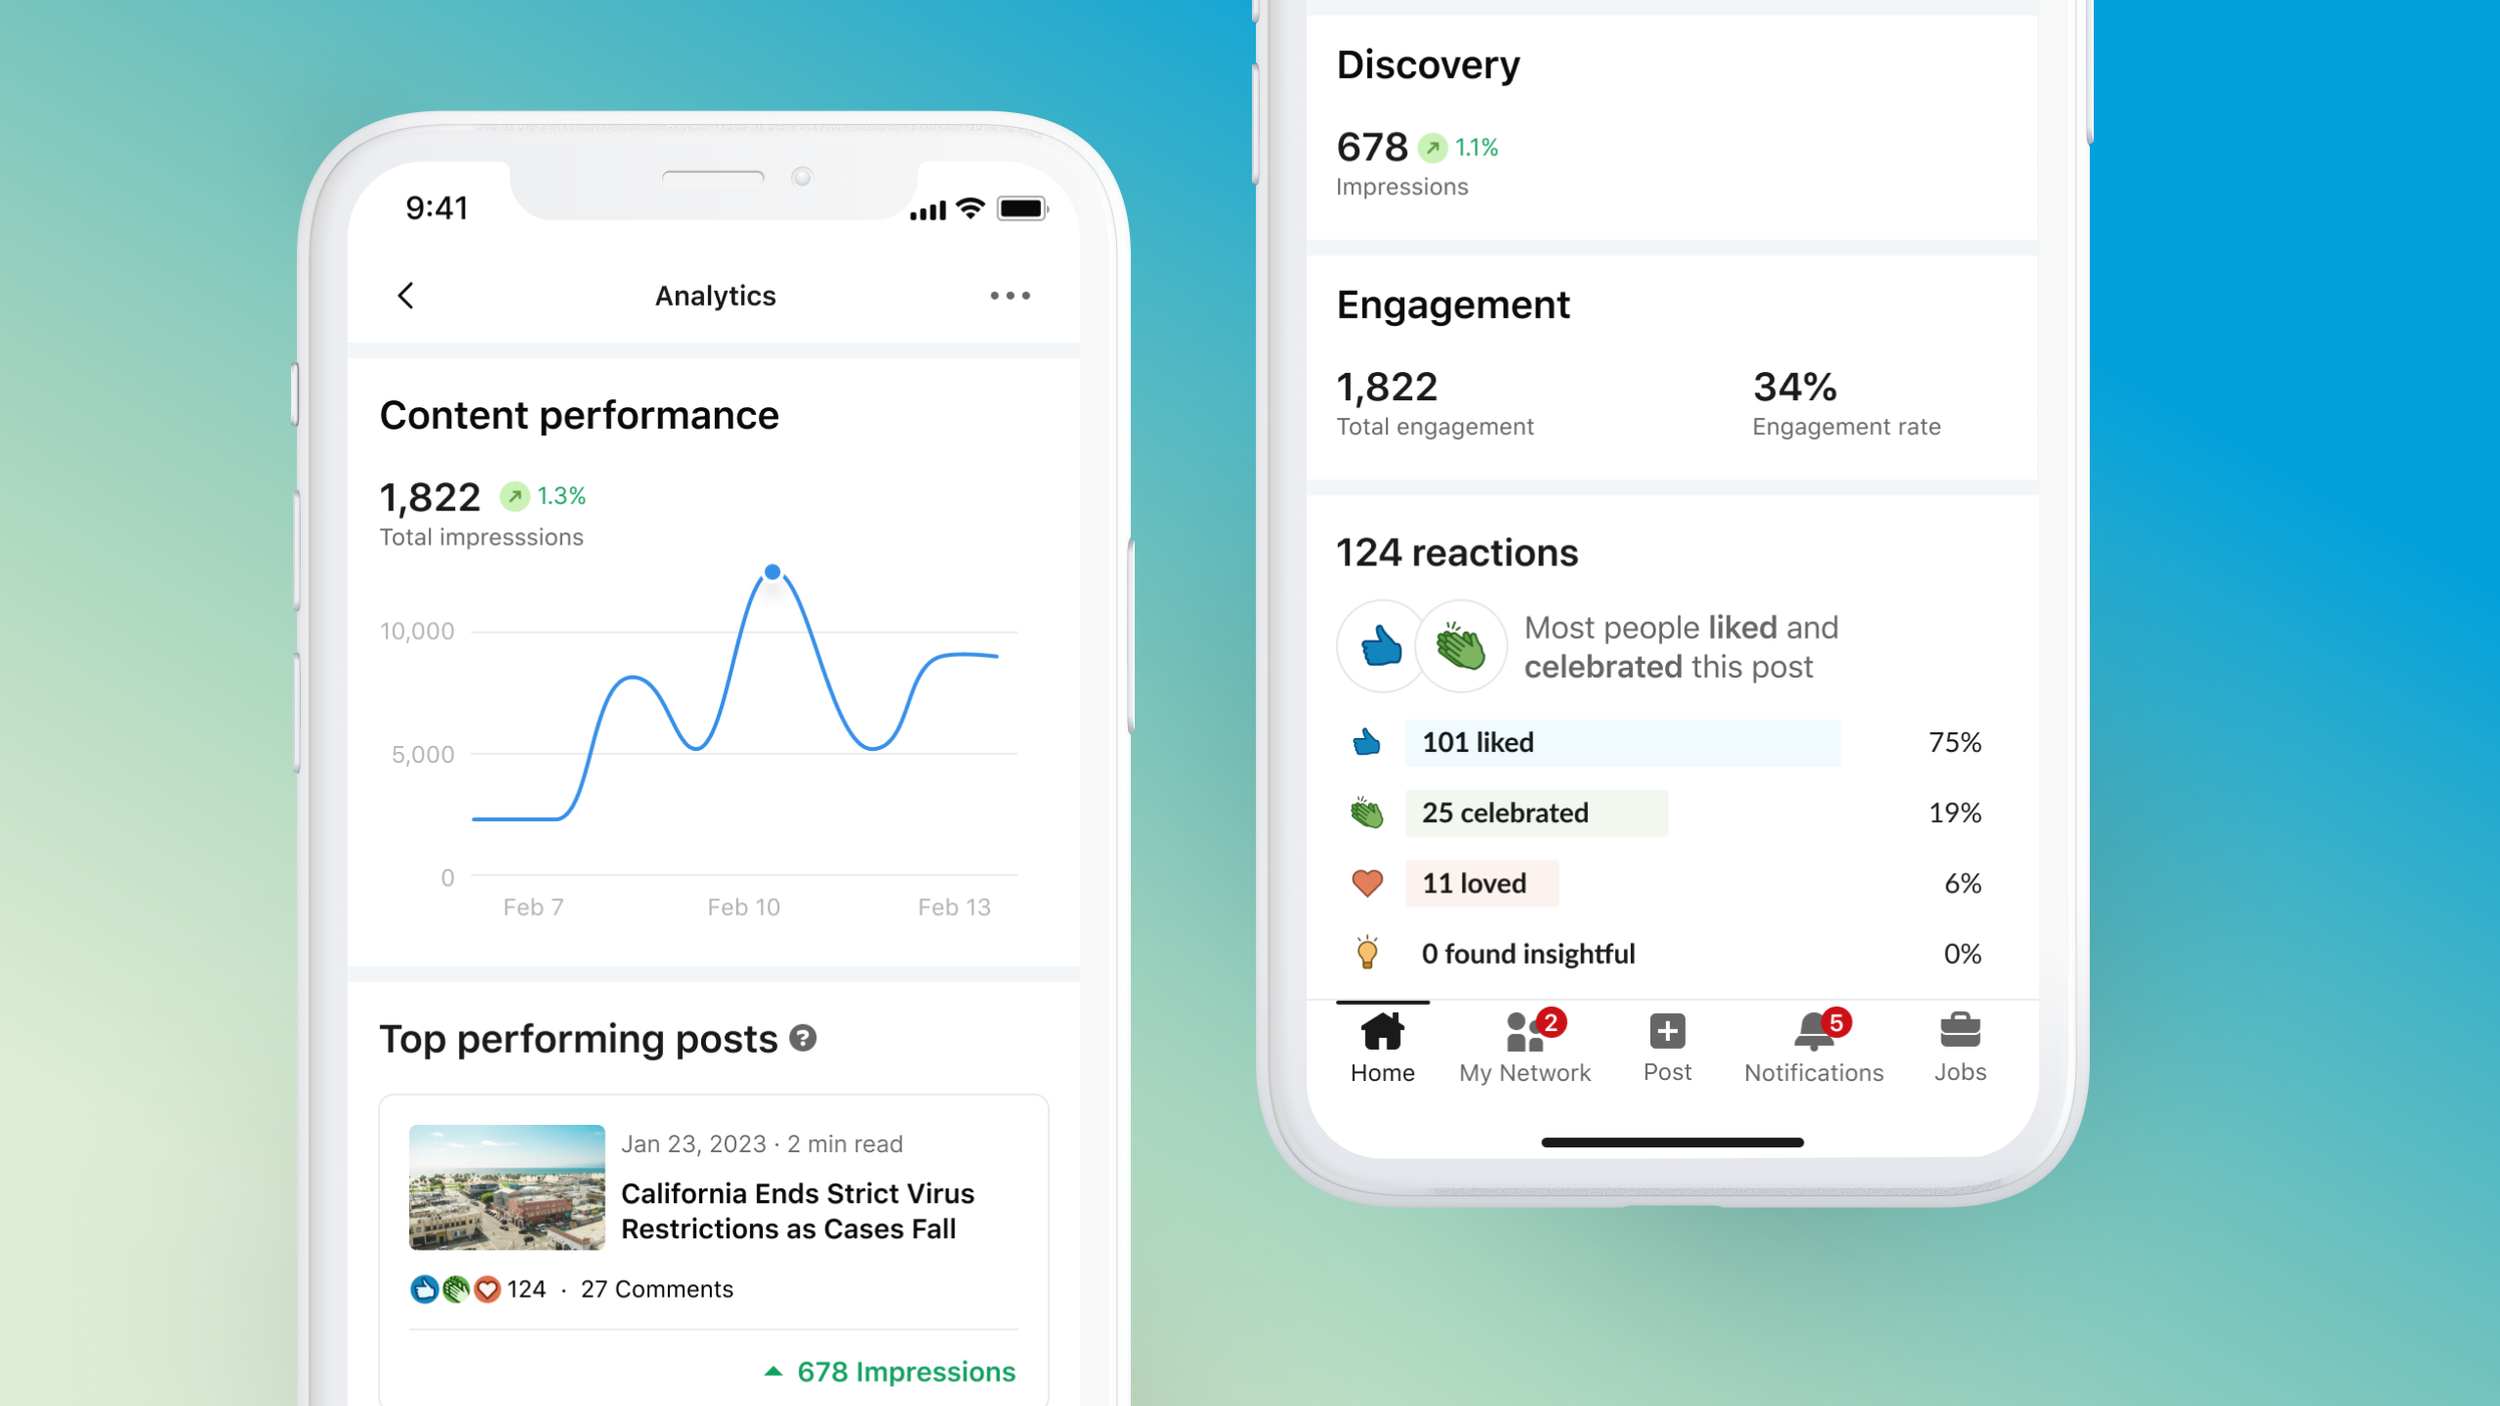
Single Post Analytics
Creators can get a deep dive into the data for each post and build relationships with those who engage
“The biggest thing for me is lack of analytics of my audience. I have 10K connections and 30K followers, and I have no idea who those people are”
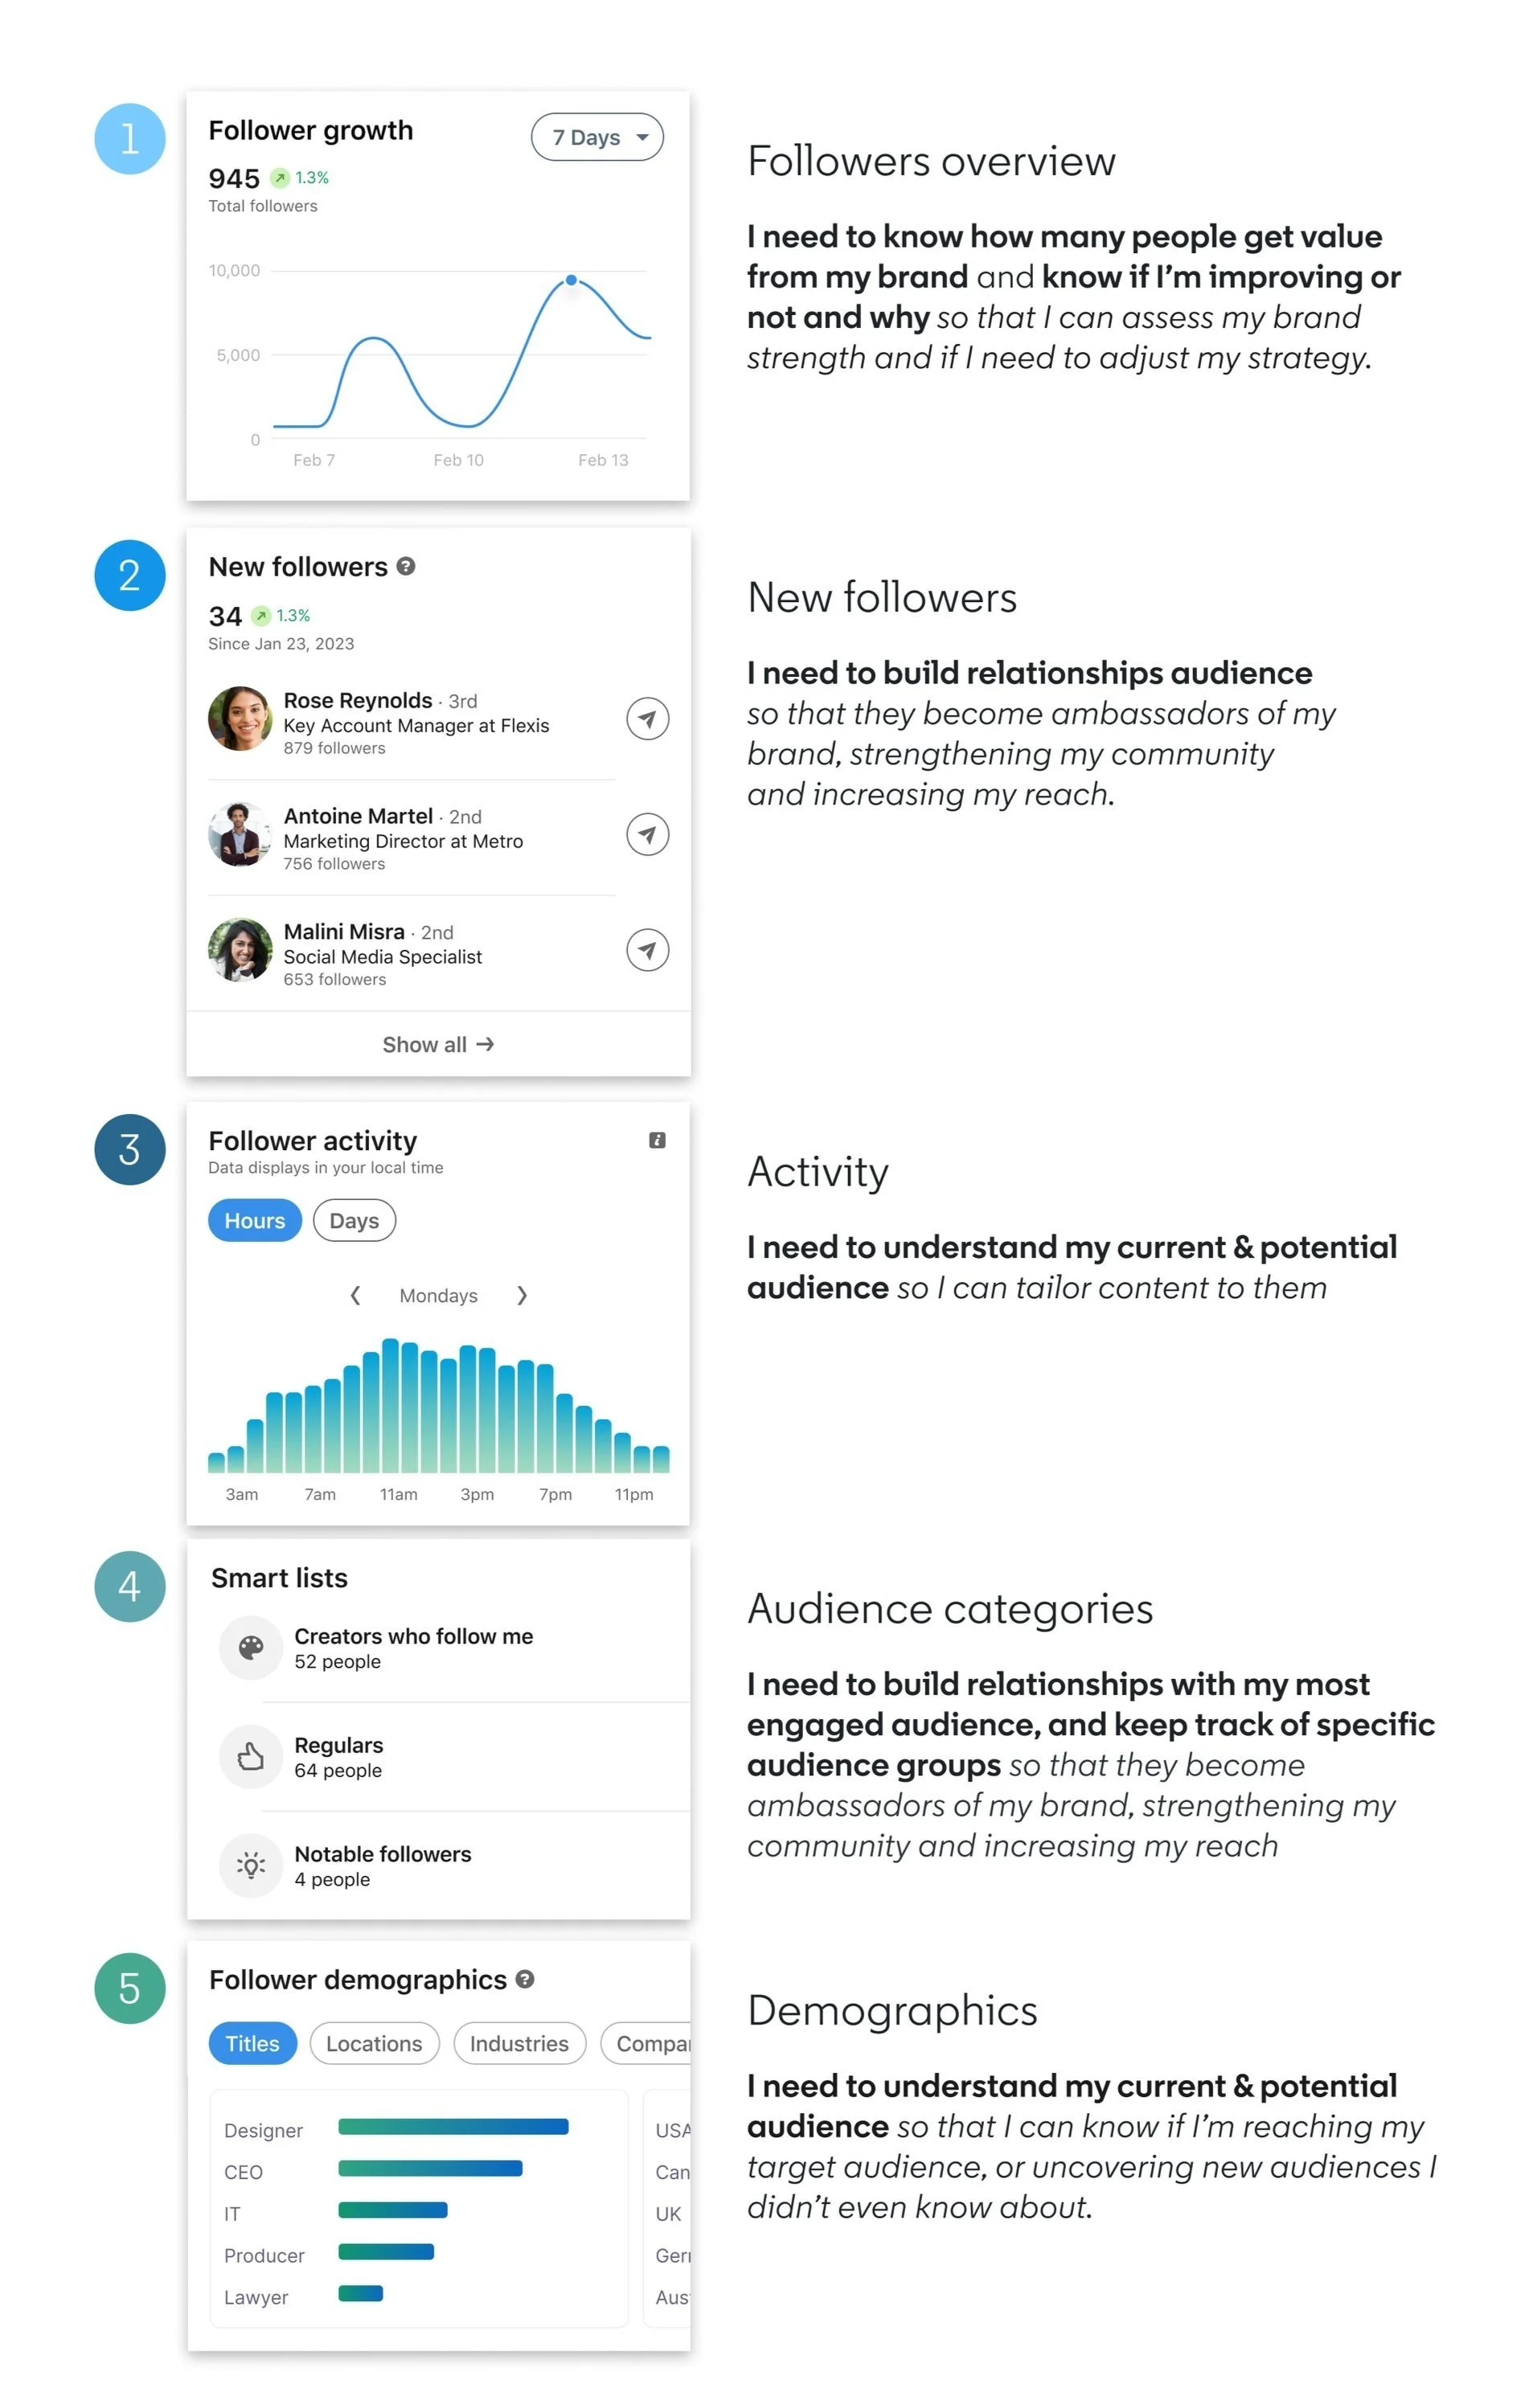
Audience Analytics
Creator needs mapping
To build the ideal page structure I created a hierarchy based on user needs defined in earlier research studies and worked backwards to design the MVP, P2, & beyond
“I would like to see in more detail the information that generates value for the creator, such as seeing the posts that have had the most engagements and created a positive impact for me”
Content Analytics
Top performing posts
The idea for designing this feature came from seeing hundreds of creators doing the work themselves to put together their own versions of Linkedin “wrapped” and trying to do the calculations to understand which of their posts performed the best.
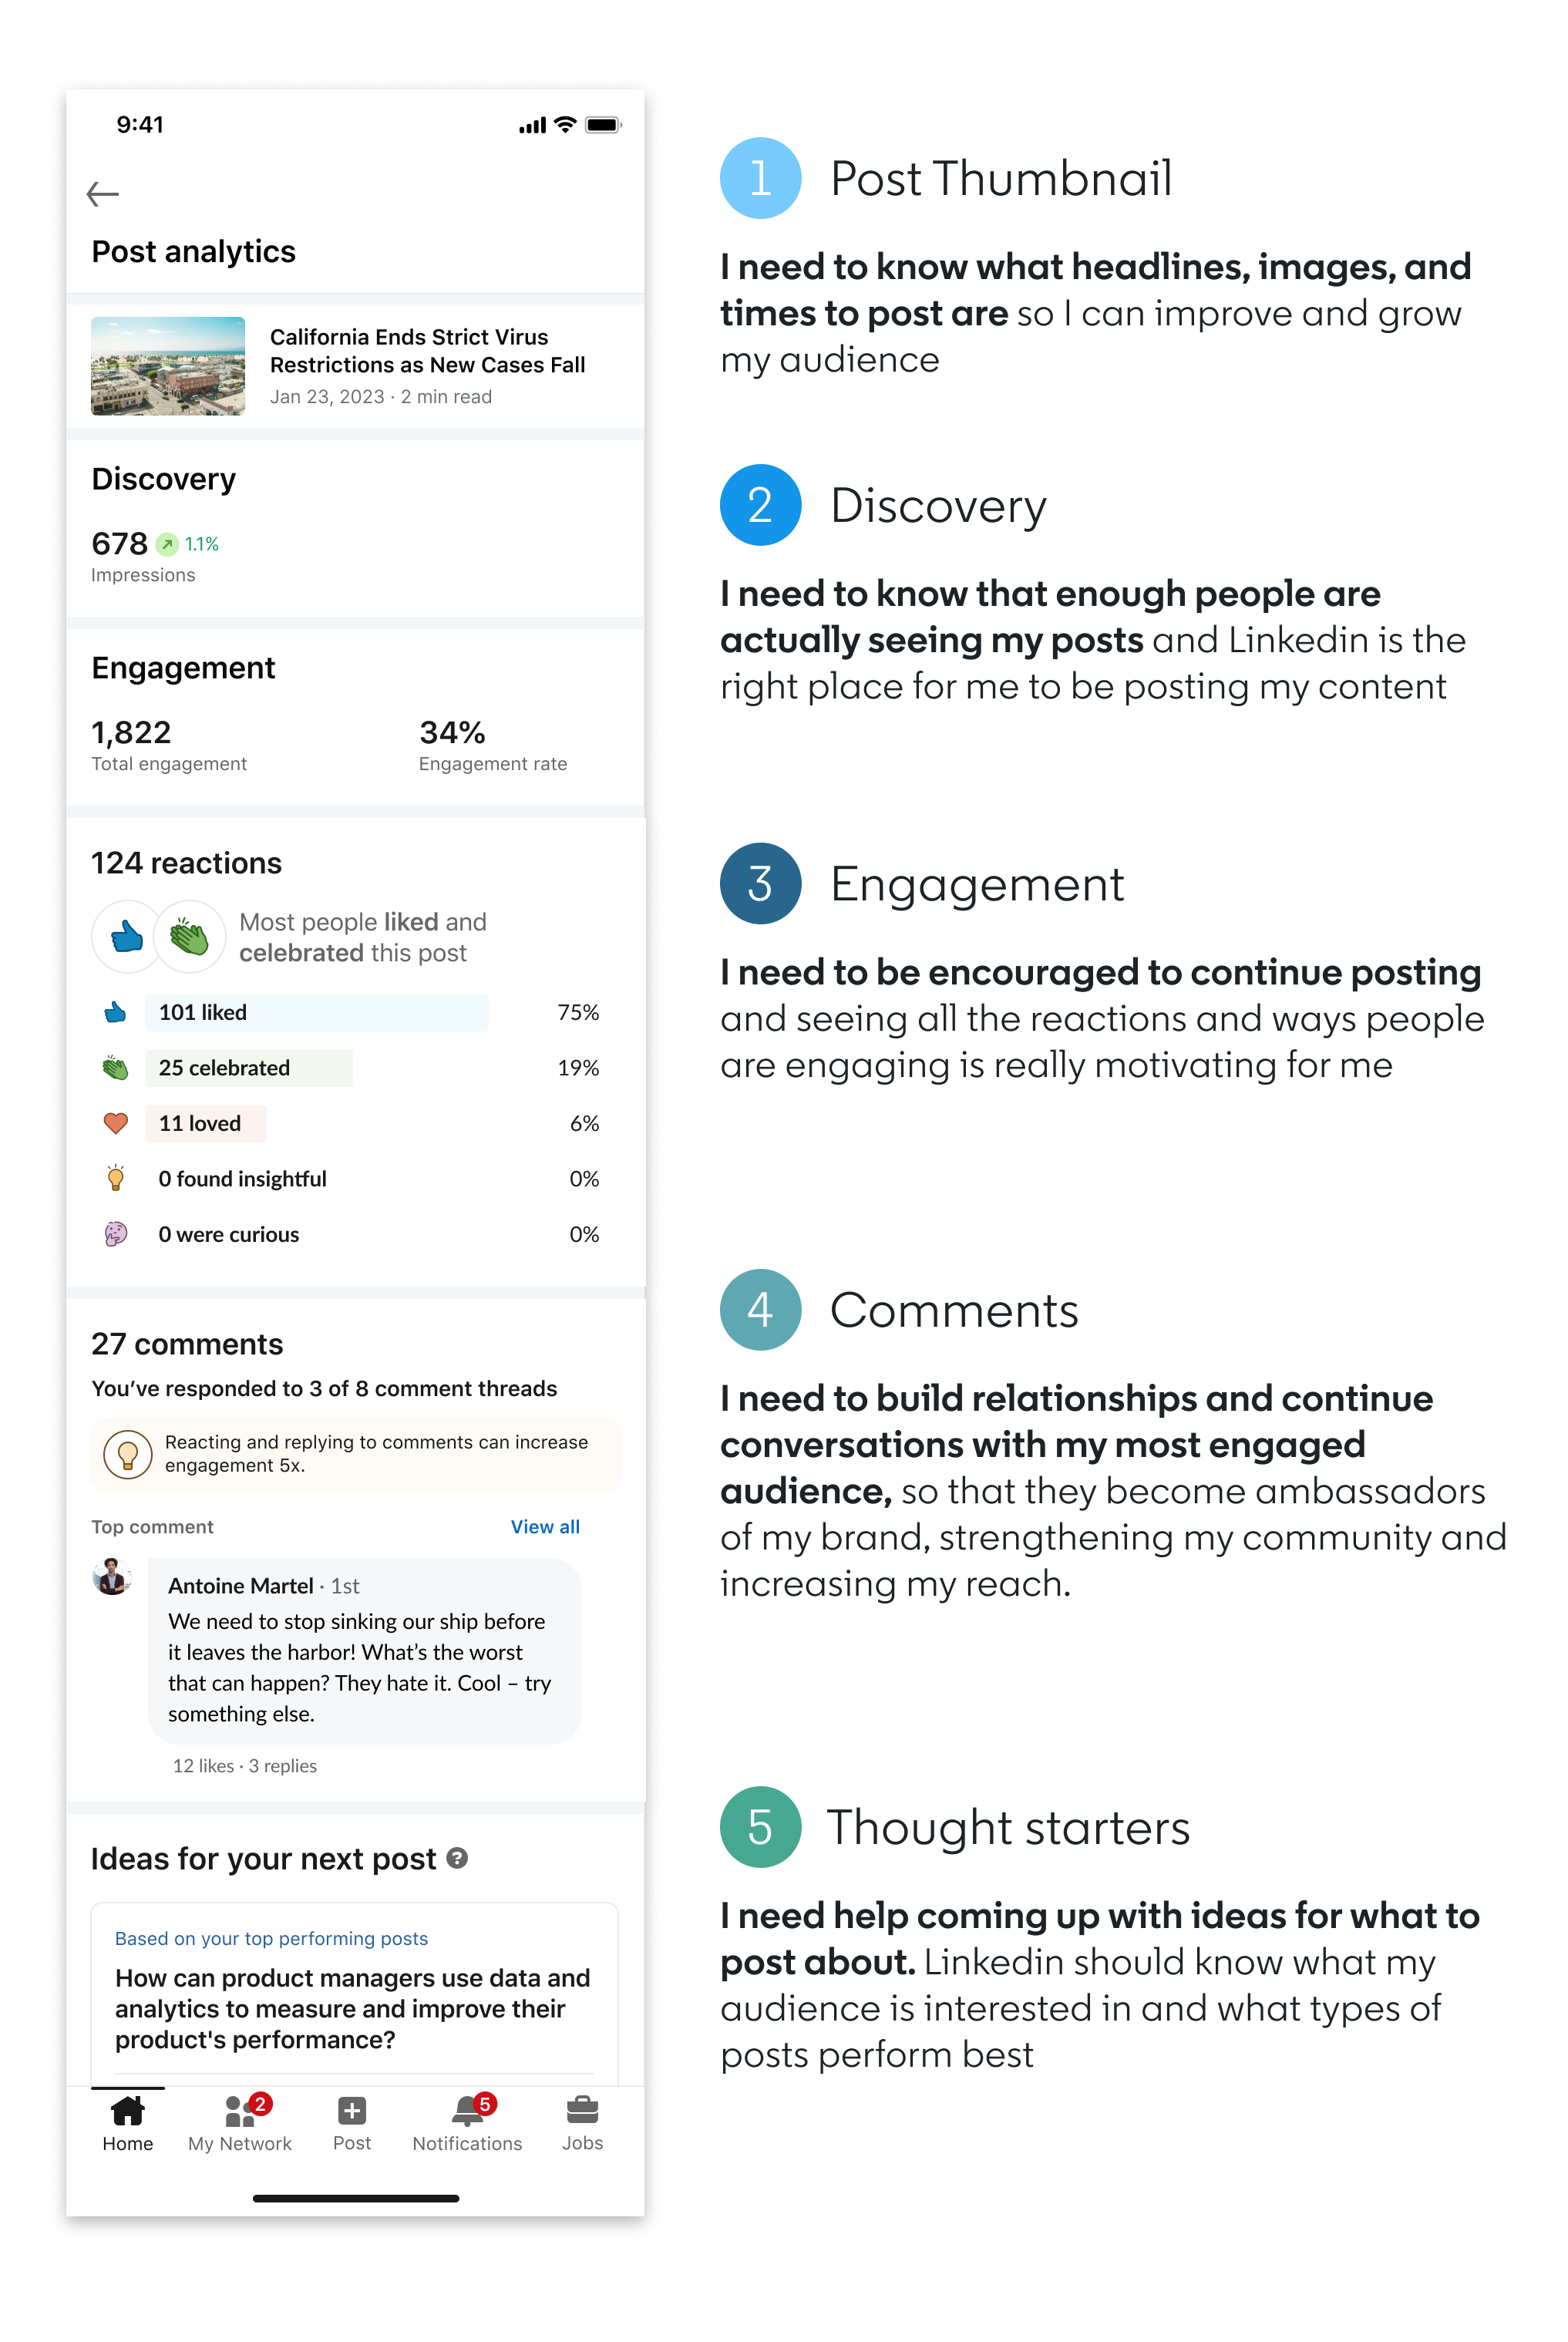
Single post analytics
Emotional needs mapping
Sharing content on Linkedin can be an intimidating process. People are worried about looking bad professionally, or just not gaining any traction with what they post. It’s an emotional journey to go through and for new creators it’s important to be able to see that the energy and time was worth it by looking at their post analytics.

Emotional moments in the new creator journey have a huge impact on whether they will continue sharing on Linkedin. This map was used in stakeholder meetings to gain alignment on prioritizing new features and ux improvements
Working within the design system
I explored many iterations of each page, component module to ensure the user experience was intuitive, the hierarchy was clear, users were able to accomplish their tasks and meet the goals of the business, while also remaining within the design system.
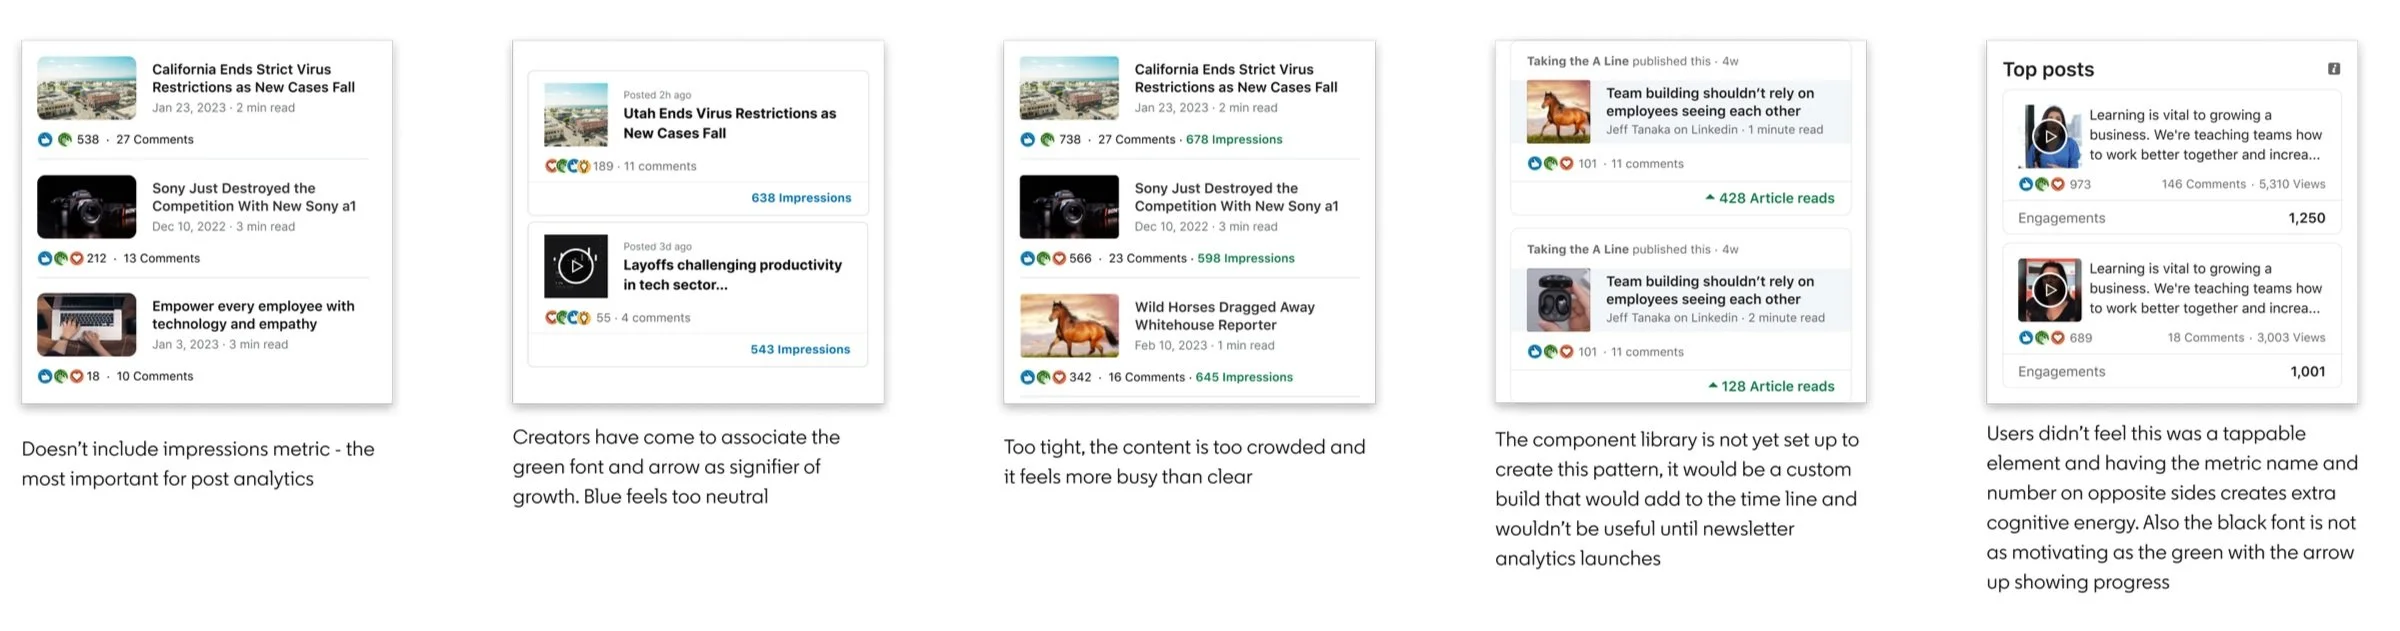
Explorations
One of the first projects I took on when starting was designing a new module that listed the posts with the best engagement and impression numbers. This is just a few of the explorations that didn’t make the cut.
Product Principles
Keep it simple but rich in information
Help connect the dots with actionable insights
Put the focus on engagement and relationship building
Celebrate the highs and be compassionately honest about the low
Always provide a path, no dead ends
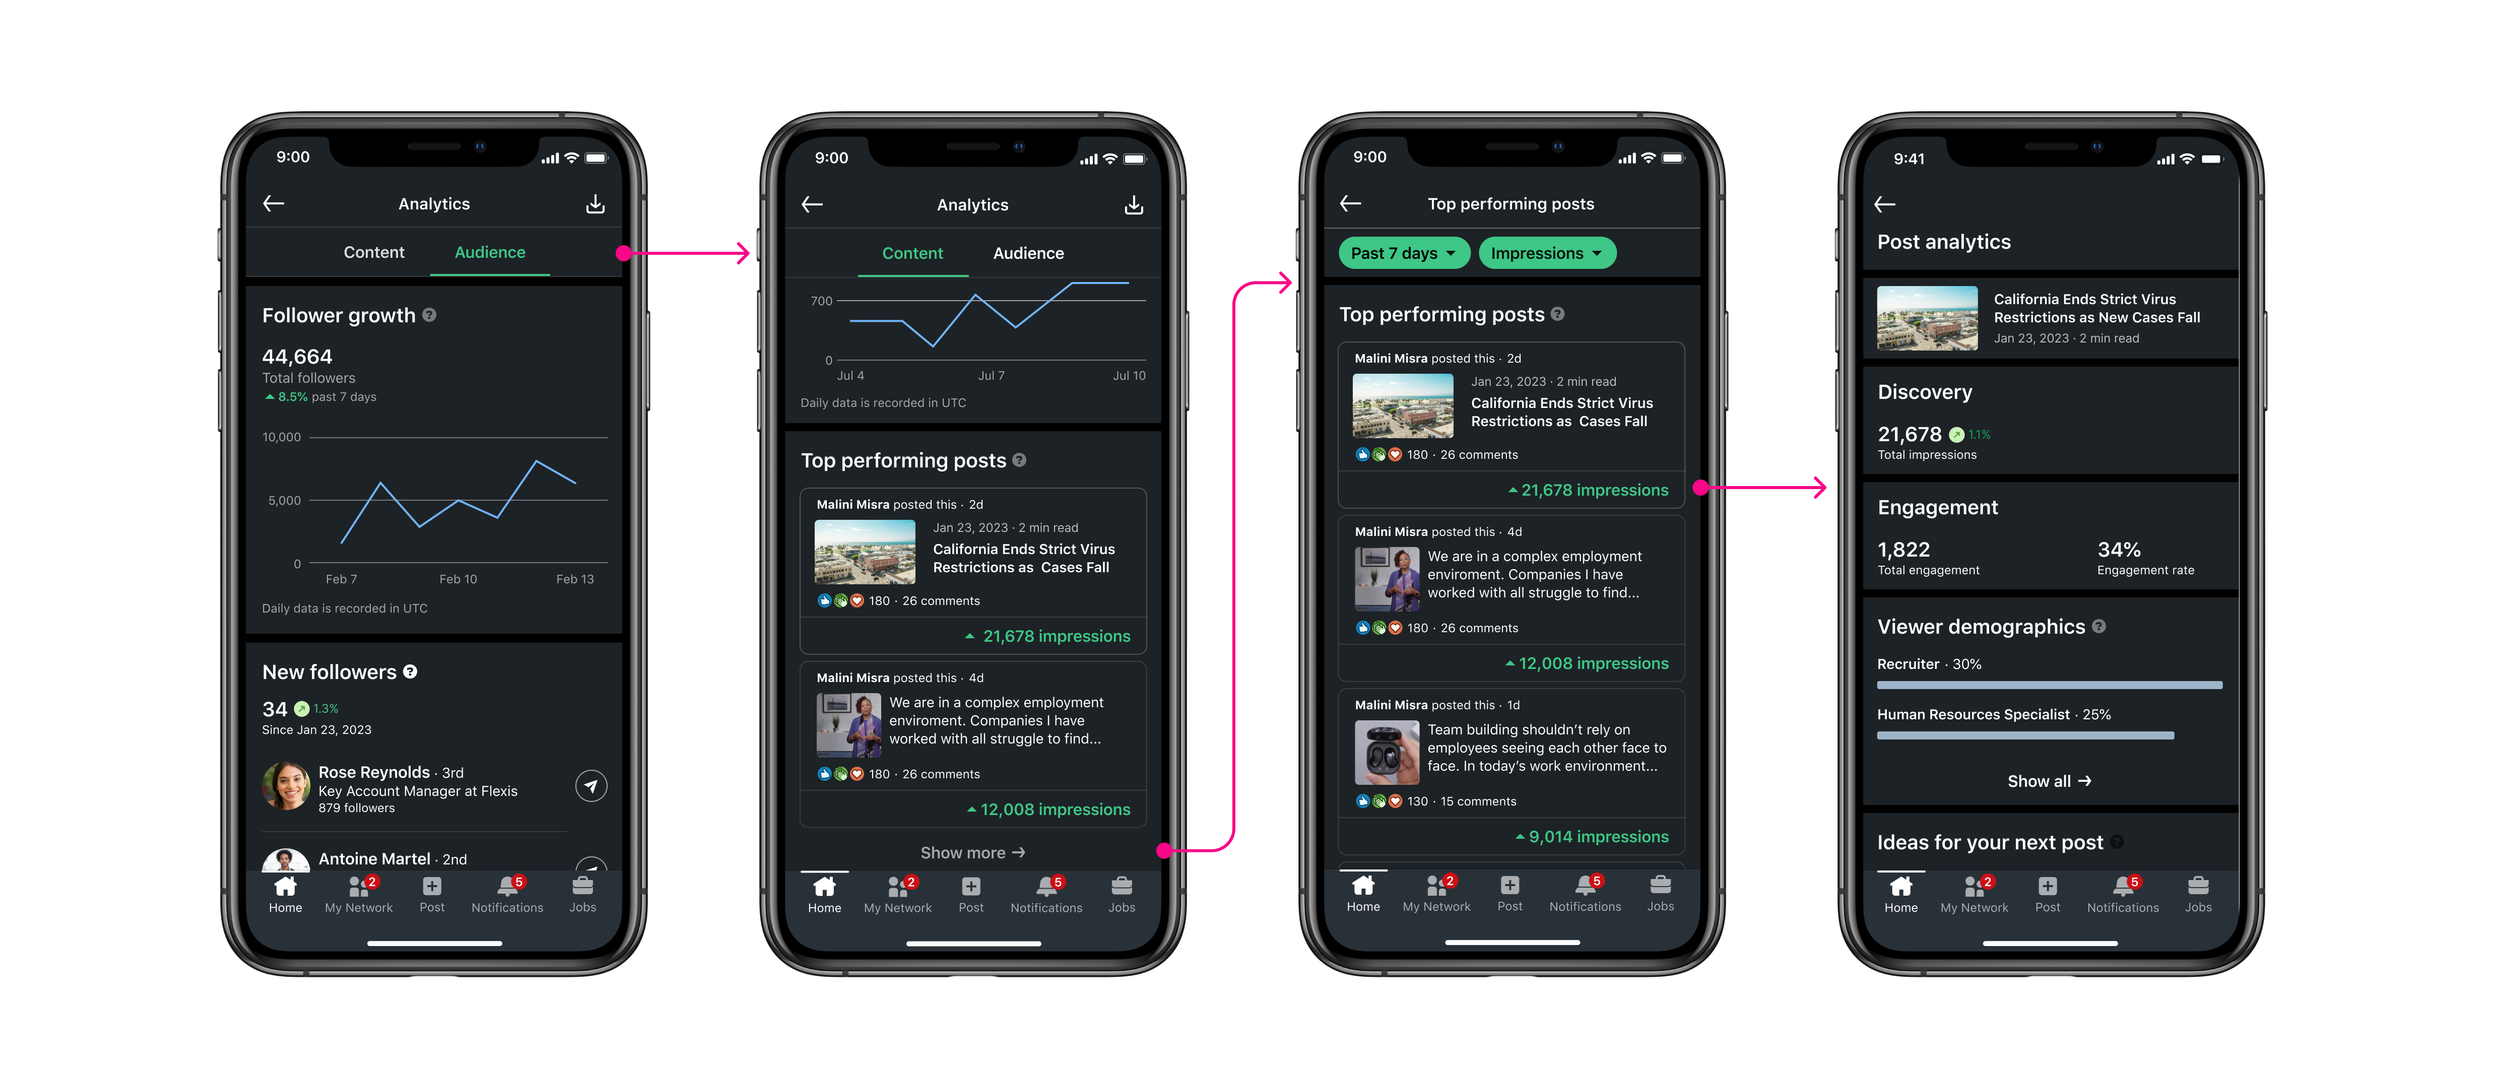
Dark mode designs
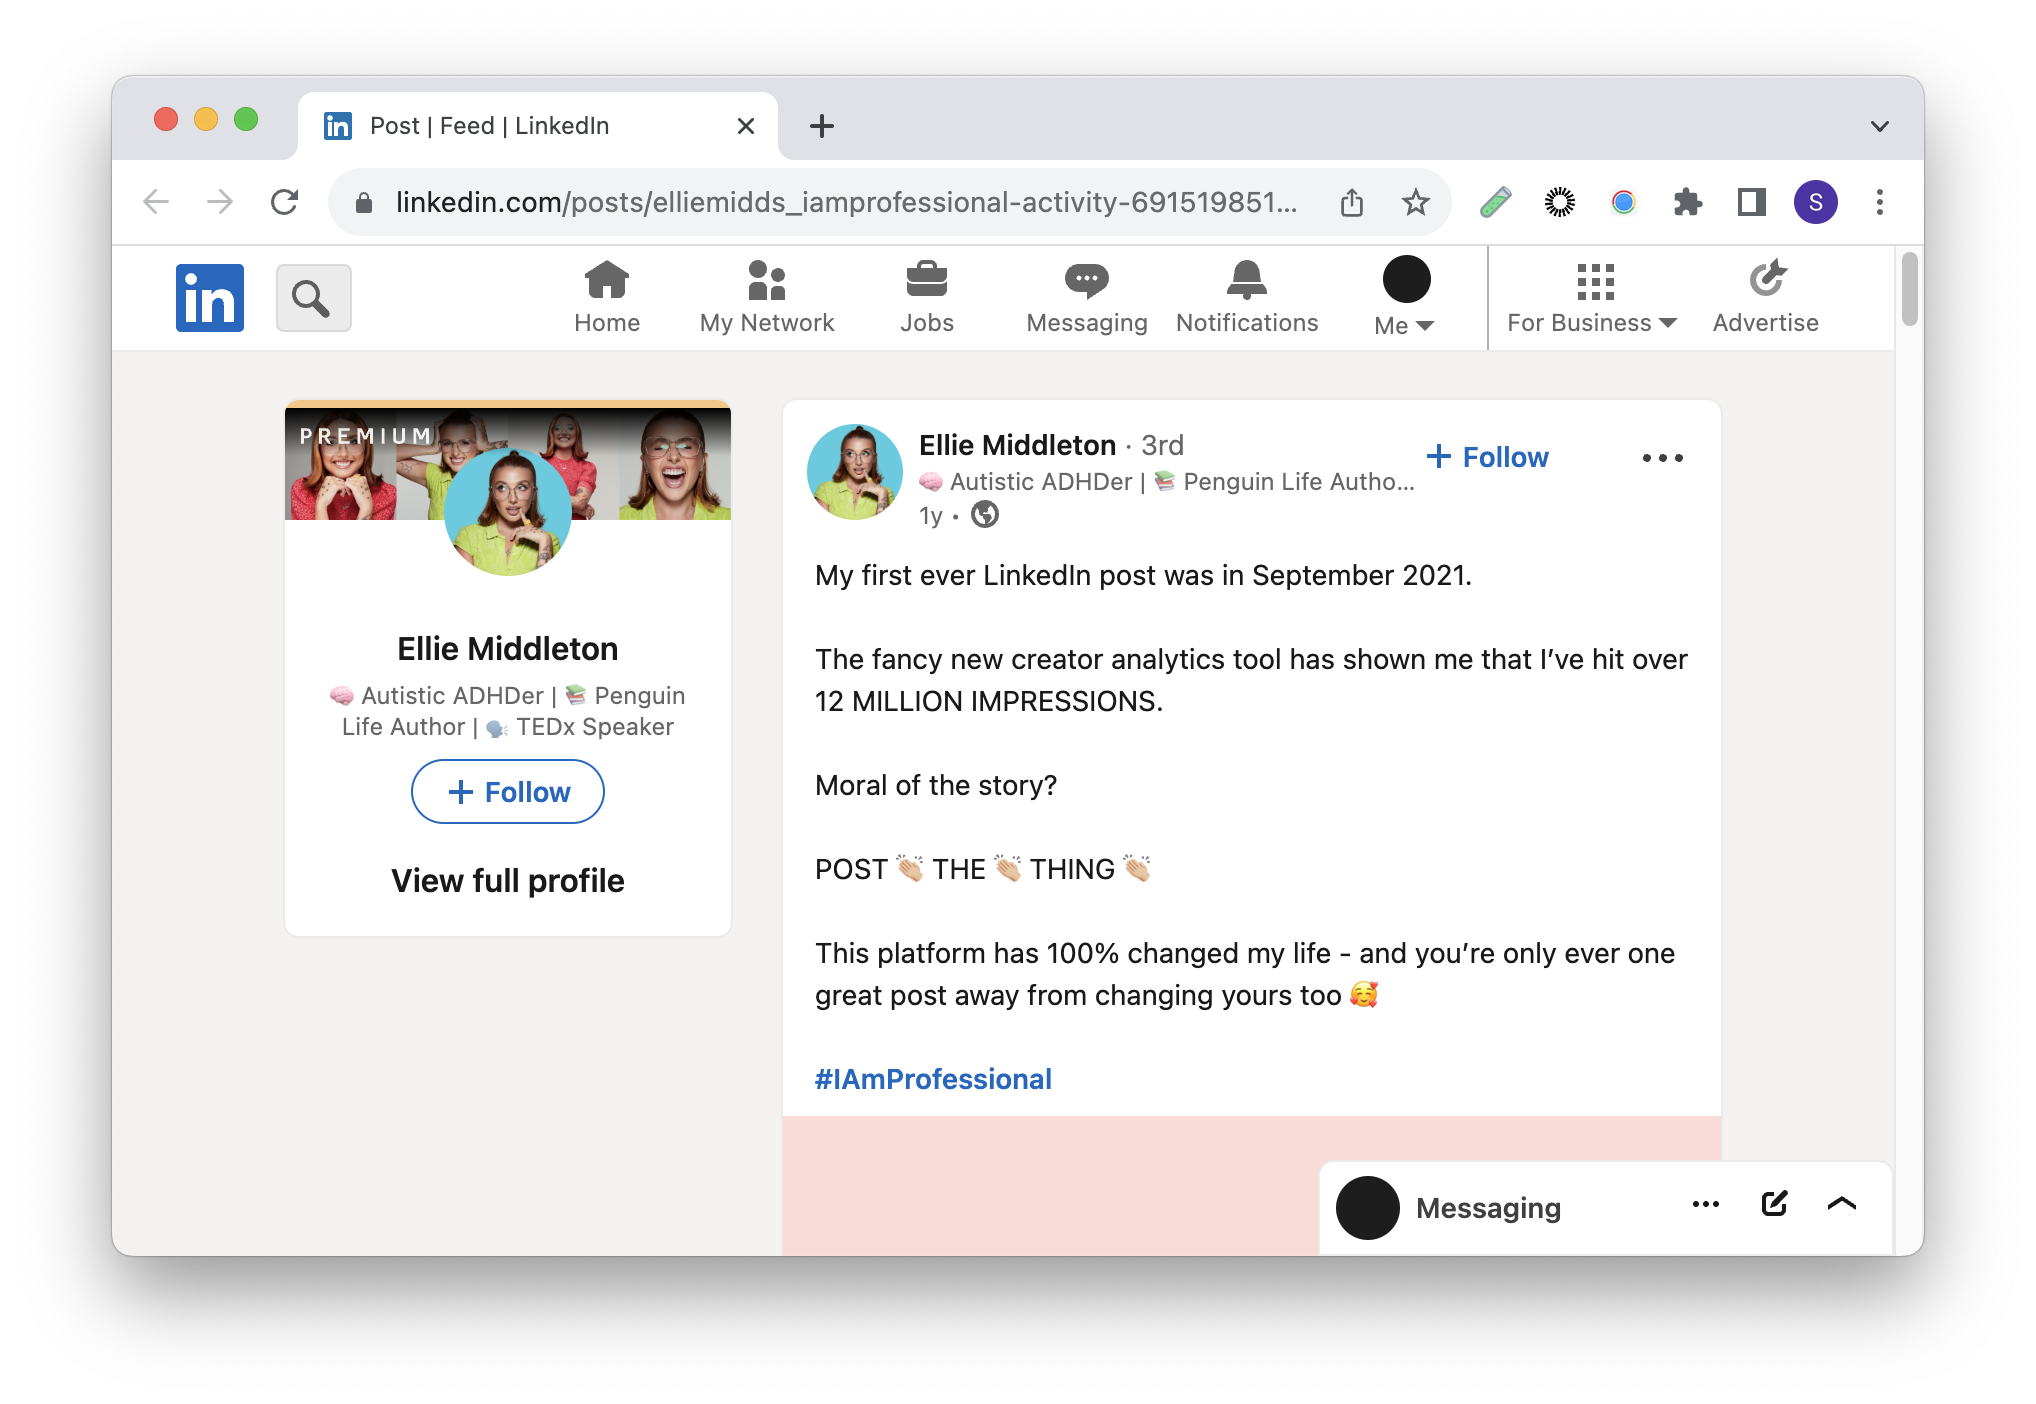
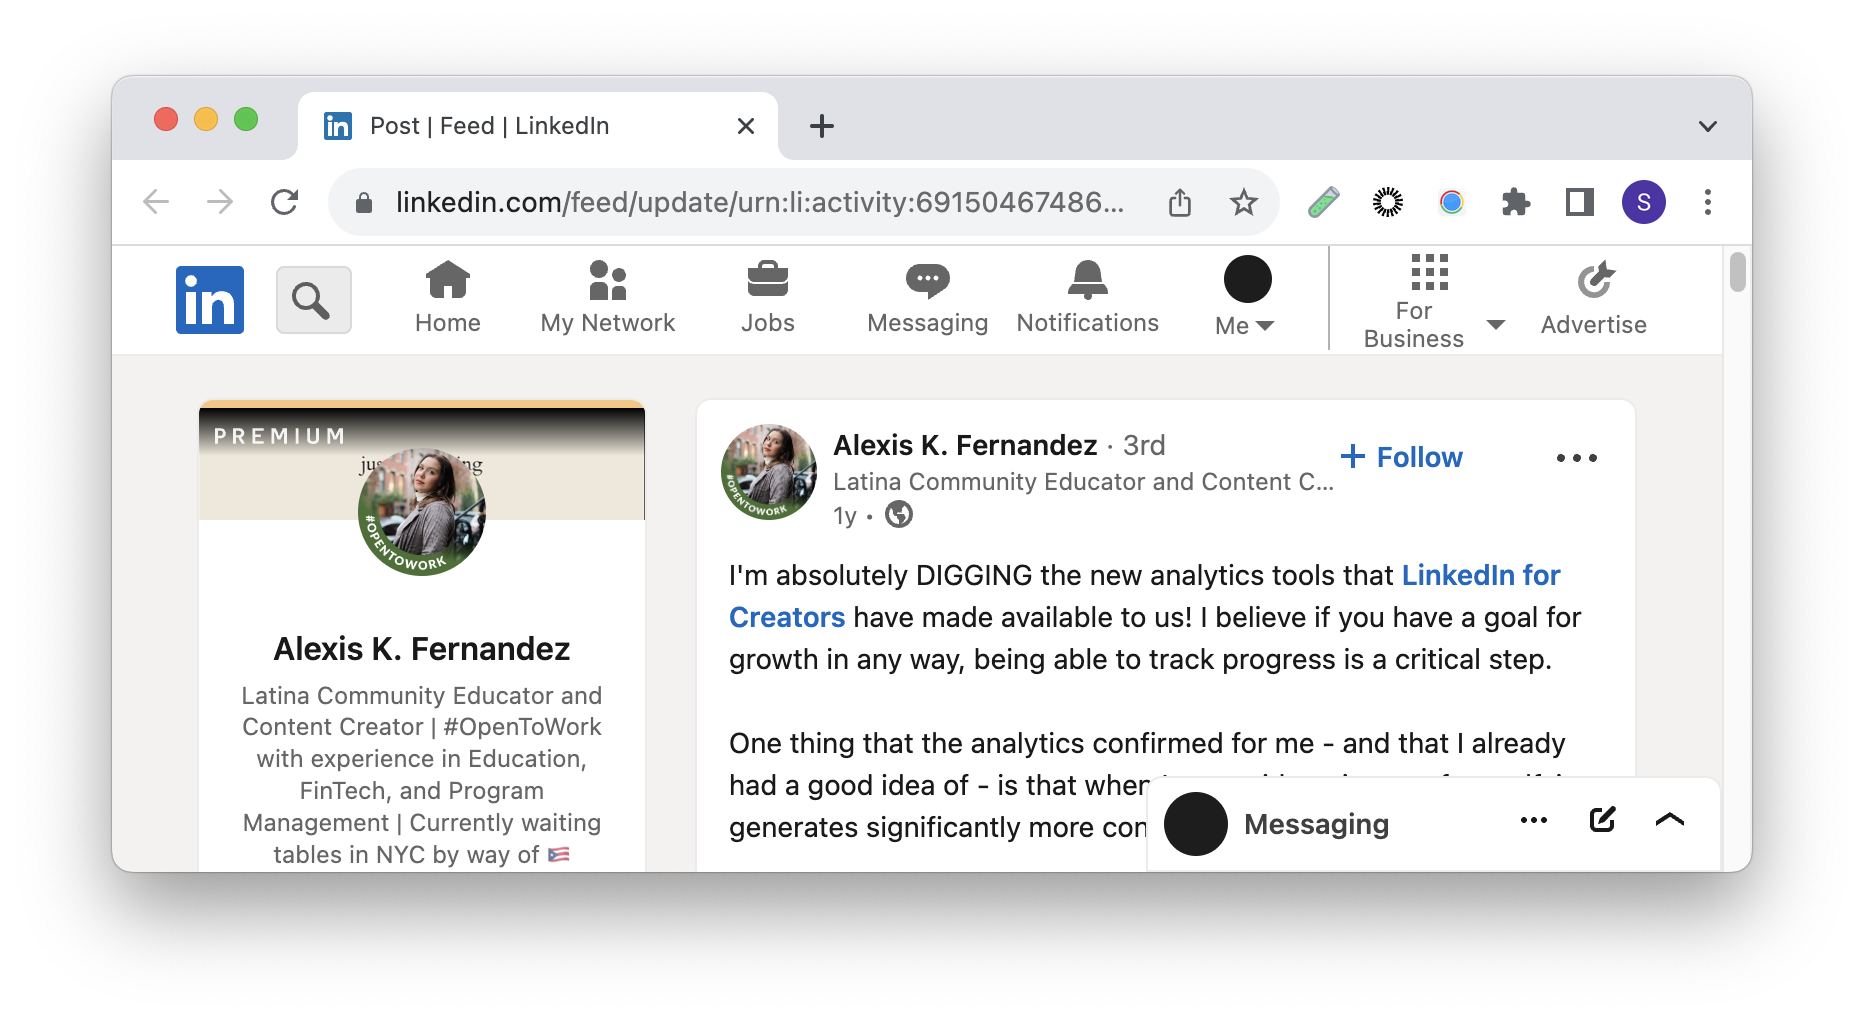
Impact
With the launch of the first phases of creator analytics we’ve seen a huge out pour of excitement and even more ideas for how to continue to improve the experience for creators on Linkedin.
More UX improvements, new features, and better tools are currently in the works, stay tuned!